
RLX

RiskLynx Software

RISKLYNX

QRA software to map consequences, exposure and societal risk in one auditable workspace.

Project status Browser-based QRA
Core output Risk curves & contours
Method base TNO / CCPS / ALOHA
app.risklynx.com / Dispersion model
RiskLynx Dispersion modeldrop 02-dispersion-plume.png into frontend/img/screenshots Map-native dense-gas dispersion footprint with live wind and stability inputs.
Map-native dense-gas dispersion footprint with live wind and stability inputs.

Assess hazardous scenarios with a map-first risk workflow.

RiskLynx helps process-safety teams model release consequences, estimate exposed population, and generate defensible individual and societal risk deliverables without moving between disconnected desktop tools.

The platform is built for studies that need transparent assumptions, traceable calculations and practical outputs that reviewers can follow.

Try RiskLynx

A guided product walkthrough for QRA teams.

Present RiskLynx with a concise product reel that moves through scenario setup, consequence modelling, exposure analysis and final deliverables.
01 Define the release 02 Map the footprint 03 Count exposure 04 Prepare the report
RiskLynx overview reel 00:45
RiskLynx dense gas dispersion map
01 Build a release scenario directly on the facility map.
RiskLynx hazard buffer zones
02 Visualise thermal, toxic and overpressure consequence zones.
RiskLynx population density analysis
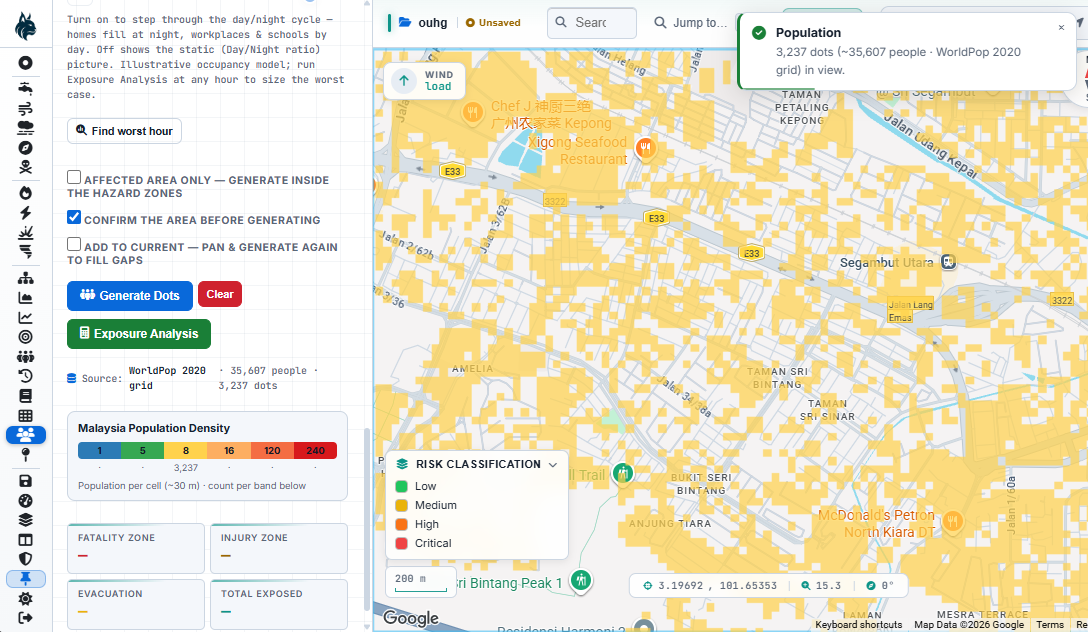
03 Calculate exposed population from mapped density layers.
RiskLynx 3D population exposure model
04 Turn the study into clear outputs for review and decision meetings.

RiskLynx supports teams in understanding industrial process risk.

Built for consequence modelling, population exposure and QRA reporting, RiskLynx keeps scenario data, mapped outputs and audit-ready calculations in the same project space.

  • Demonstrate ALARP decisions with clear contour and curve outputs
  • Produce dependable outcomes for resource allocation and design review
  • Communicate technical risk clearly to operators, regulators and stakeholders
  • Model toxic, thermal and overpressure scenarios across a facility basemap
  • Support safer energy transition, storage and process-industry projects
Learn more

From release scenario to societal risk on a real map.

Each engine renders onto the same workspace so the scenario, its consequence footprint and the affected population stay connected.

Consequence & dispersion

Model the release, see the footprint.

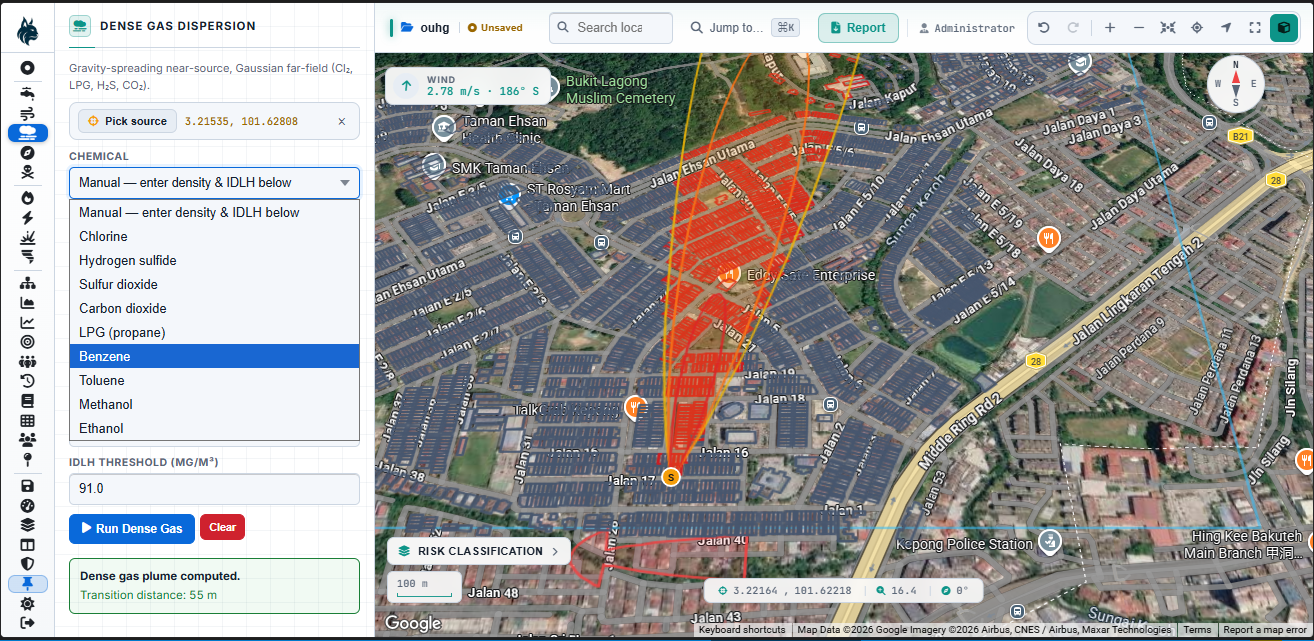
Define a source term, run jet fire, pool fire, BLEVE, VCE, Gaussian or dense-gas models, then review the footprint against wind and stability inputs.

  • Source-term discharge rate and release duration
  • Thermal, toxic and overpressure ranges per case
  • IDLH, ERPG and AEGL concentration thresholds
app.risklynx.com / Dispersion
RiskLynx Dispersiondrop 02-dispersion-plume.png into frontend/img/screenshots Dense-gas footprint driven by live wind speed and atmospheric stability.
Dense-gas footprint driven by live wind speed and atmospheric stability.
Hazard zones & casualty

Grade the hazard, count the consequence.

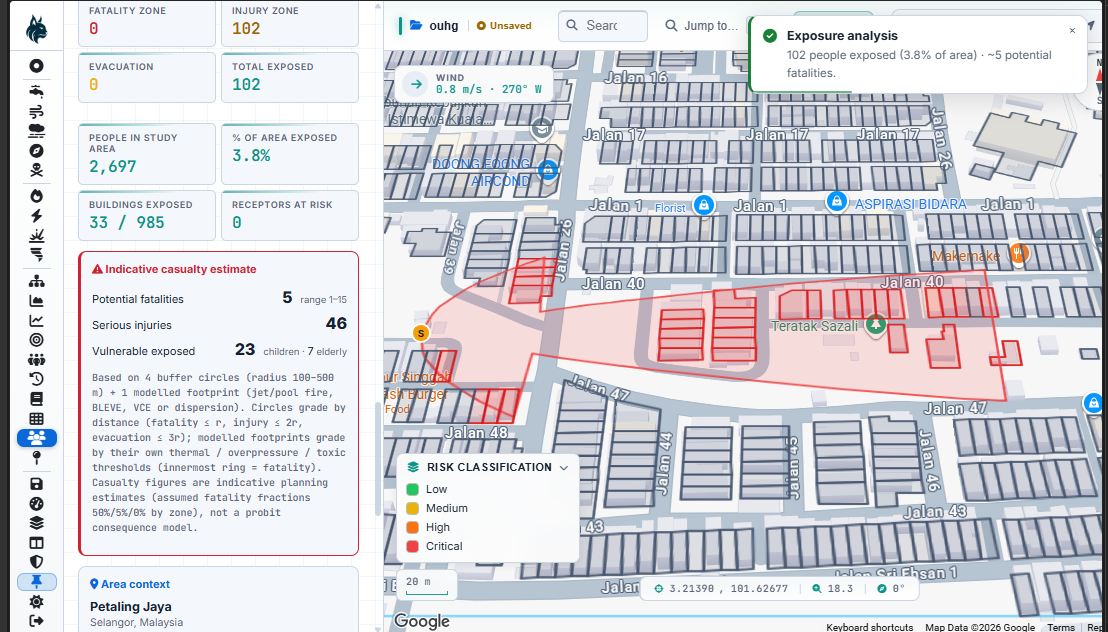
Lay graduated risk-class buffers around a source, classify them from low to critical, and estimate casualties against the mapped population layer.

  • Risk-class buffers with GeoJSON and KML import/export
  • Fatality, injury and evacuation zoning
  • Indicative casualty estimate per scenario
app.risklynx.com / Hazard zones
RiskLynx Hazard zonesdrop 04-buffer-circles.png into frontend/img/screenshots Graduated risk-class buffer zones with an indicative casualty estimate.
Graduated risk-class buffer zones with an indicative casualty estimate.
Population & exposure

Count real people, not a population guess.

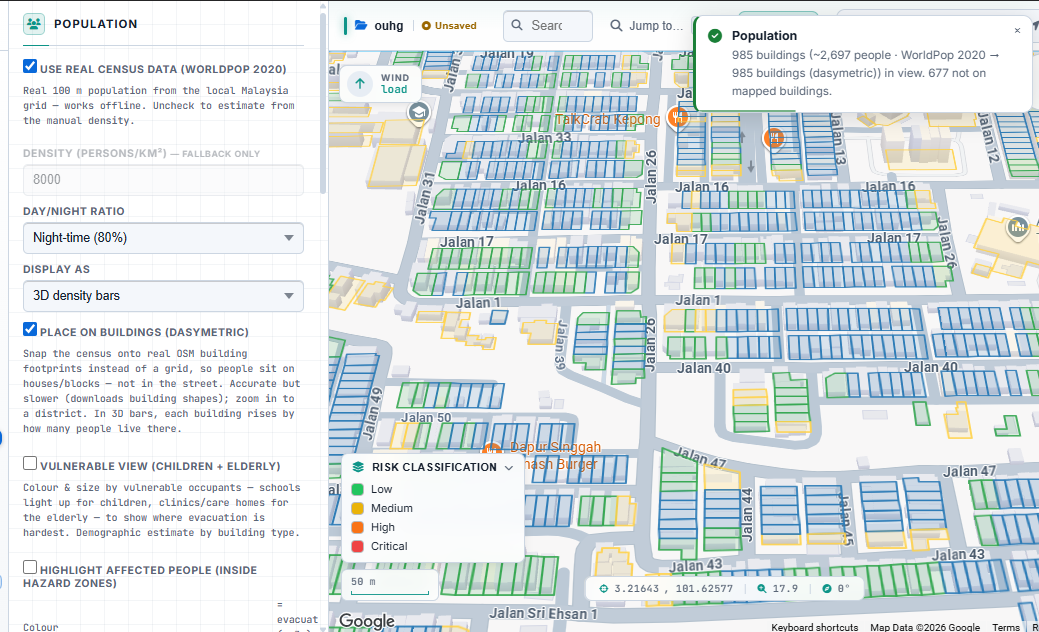
Load census density into the map and calculate affected population by cell, occupancy period and scenario footprint.

  • WorldPop census density across the study area
  • Day and night occupancy modes
  • Exposure totals that remain traceable to source data
app.risklynx.com / Population density
RiskLynx Population densitydrop 05-population-density.png into frontend/img/screenshots Population density cells over the study area for exposure calculations.
Population density cells over the study area for exposure calculations.

The QRA deliverable suite, in one workspace.

01

Consequence modelling

Thermal radiation, toxic dispersion and overpressure footprints from defined release cases.

02

Individual risk contours

Location-specific individual risk and IRPA outputs across receptor points and mapped zones.

03

Societal risk curves

F-N curves, PLL and exposure summaries for scenario ranking and ALARP communication.

04

Map-native reporting

Scenario maps, contours, population overlays and tabular readouts prepared for export.

Clear outputs for studies, reviews and decision meetings.

Individual risk contoursLSIR / IRPA
Societal riskF-N curves
Population exposurePLL / affected count
Scenario evidencemaps + tables

Frequently asked questions

What studies can be addressed with RiskLynx?

RiskLynx is intended for QRA, consequence modelling, population exposure and mapped risk deliverables for process-industry scenarios.

What results are generated from RiskLynx?

The platform focuses on mapped consequence footprints, individual risk contours, societal risk curves, exposure summaries and structured study outputs.

Can RiskLynx support stakeholder communication?

Yes. Maps, curves and population readouts are designed to make technical risk easier to review with operators, regulators and project teams.

How do I request access?

Use the demo form below. Accounts are issued by an administrator after the workspace is prepared.

Bring RiskLynx into your next QRA engagement.

Tell us about your studies and we will set up a focused walkthrough for your team.

Browser based Map native Auditable QRA

Prefer email? Write to sales directly.